How to Tax For No Deficit
Kristian Zuzek, 2025-06-22
Introduction
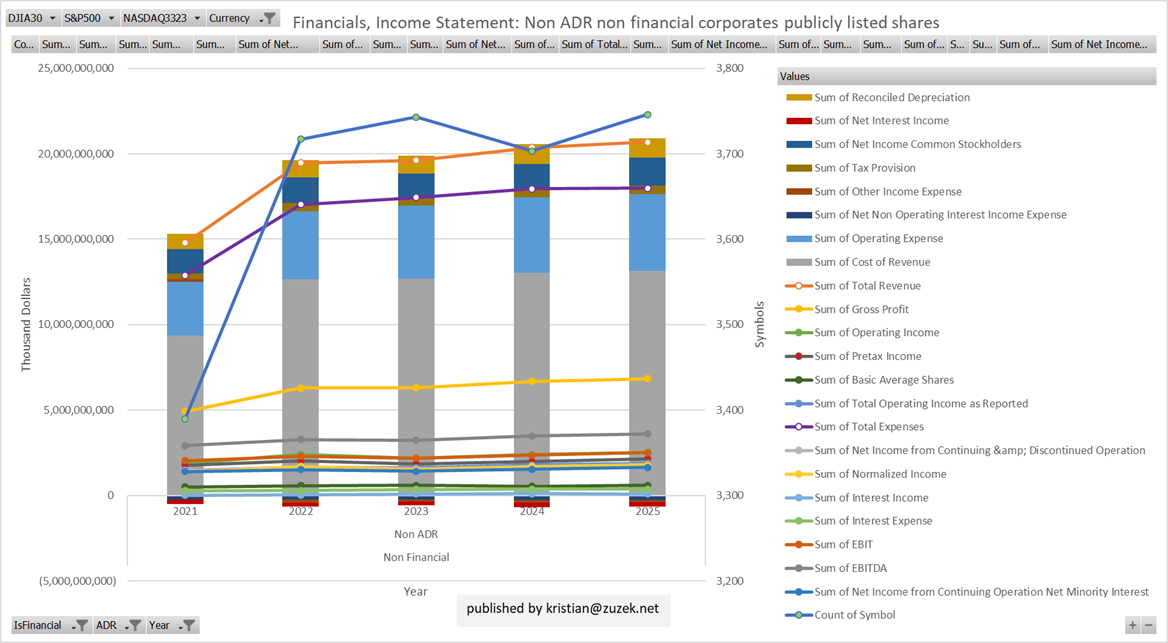
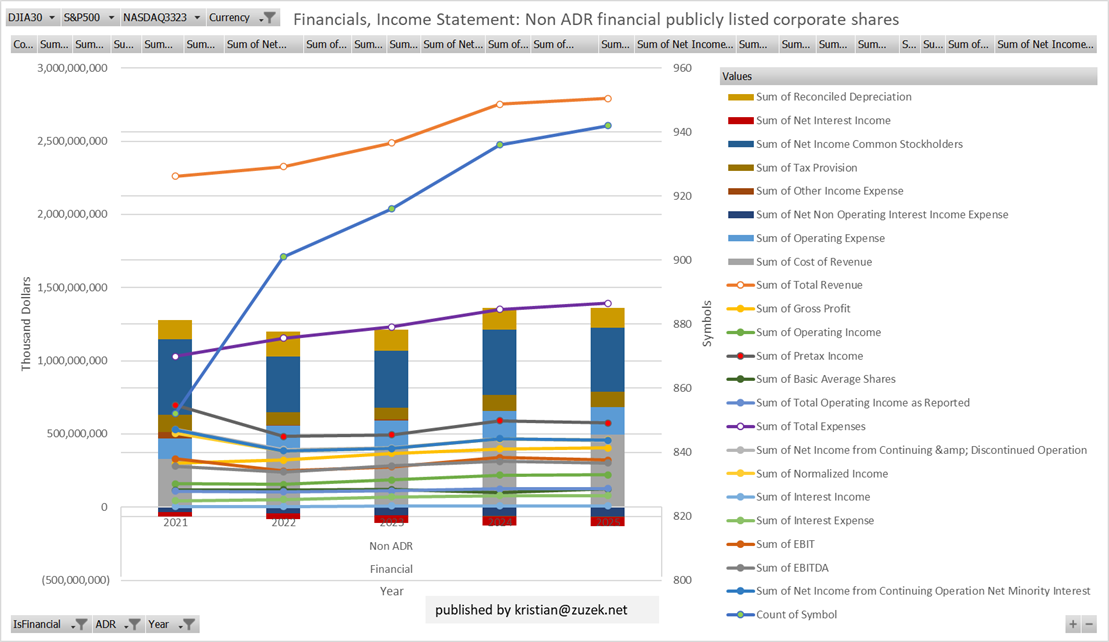
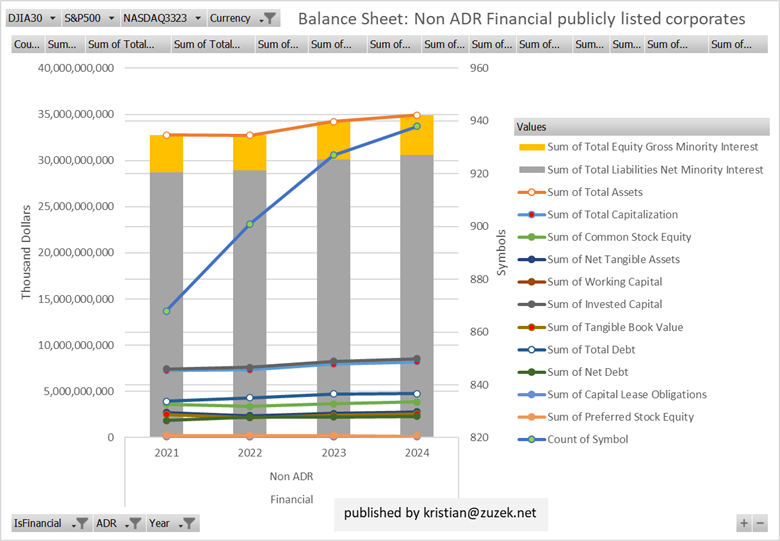
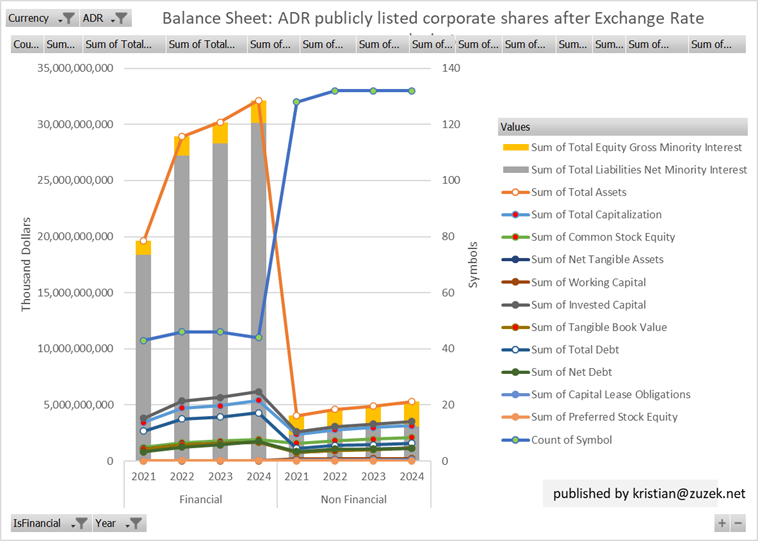
Not in theory, it is possible to balance the federal budget. I personally think there are implicit guarantees from the federal government by persons trying to protect their dubious “investments” that have made fiscal policy very tailored to “socializing losses”. These “socializing losses” have been written about in the past, probably in the present, and probably in the future but I don’t think there is time or space for the facts in another simple proving of accounting identities. The non-theory is that if money exists in one account then that money can be moved to another account. This example assumes no creation of money supply of any number from M0 to M-infinity. From various sources, the estimated budget deficit for fiscal years 2025 or 2026 is approximately $1.8 trillion. It can be shown that $1.8 trillion can be raised from corporate taxes transferring money from corporate accounts to the federal accounts. Unlike corporate accounts, the federal government will spend every cent as a certainty. Unlike socializing losses, this transfer of money is not for the coverup of any fraud, regardless of the unknown legal status of any affected corporate legal entities. The balancing of the federal budget by raising corporate taxes would also be estimated to decrease the equity of publicly listed corporate shares by 13% for non-financial and 11% for financial corporates.
Table 1-3, numbers in Thousands. From Publicly Listed Corporate Shares Regulatory Filings.
Table 1
|
Year |
% of original deficit |
Estimated Deficit |
Hypothetical Corporate
Tax at 86% |
deficit-corporate tax |
actual federal deficit |
actual corporate tax |
|
2021 |
35.5% |
-986,599,579 |
2,122,819,421 |
-3,109,419,000 |
-2,775,350,000 |
334,069,000 |
|
2022 |
-27.0% |
371,597,214 |
2,148,971,214 |
-1,777,374,000 |
-1,375,920,000 |
401,454,000 |
|
2023 |
7.3% |
-124,451,860 |
2,015,892,140 |
-2,140,344,000 |
-1,695,240,000 |
445,104,000 |
|
2024 |
6.3% |
-114,599,528 |
2,224,961,472 |
-2,339,561,000 |
-1,832,816,000 |
506,745,000 |
|
2025 |
-1.0% |
18,700,235 |
2,342,700,235 |
-2,324,000,000 |
-1,800,000,000 |
524,000,000 |
From Publicly Listed Corporate Shares Regulatory Filings
Table 2
|
Row Labels |
Pretax Income |
Tax Provision |
Effective Corporate Tax
Rate |
Row Labels |
Total Assets |
Total Liabilities Net
Minority Interest |
Total Equity Gross
Minority Interest |
Row Labels |
End Cash Position |
End Cash Position after
86% Corporate Tax Rate (End Cash - Hypothetical Tax) |
%Remaining Total Equity
Gross Minority Interest after 86% Corporate Tax Rate (Equity - Hypothetical
Tax) |
Year |
Hypothetical Tax at Rate
0.86 |
|
Non Financial |
9,779,467,382 |
2,156,124,449 |
22.0% |
Non Financial |
104,098,409,947 |
66,384,790,458 |
37,713,572,891 |
Non Financial |
10,296,537,149 |
|
|
|
|
|
Non ADR |
9,779,467,382 |
2,156,124,449 |
22.0% |
Non ADR |
104,098,409,947 |
66,384,790,458 |
37,713,572,891 |
Non ADR |
10,296,537,149 |
|
|
|
|
|
2021 |
1,770,690,504 |
345,747,680 |
19.5% |
2021 |
23,403,773,806 |
14,961,906,407 |
8,441,844,371 |
2021 |
1,984,393,981 |
795,669,147 |
85.9% |
2021 |
1,522,793,834 |
|
2022 |
2,015,906,998 |
486,822,585 |
24.1% |
2022 |
25,798,605,983 |
16,585,896,795 |
9,212,678,821 |
2022 |
2,018,688,102 |
686,462,083 |
85.5% |
2022 |
1,733,680,018 |
|
2023 |
1,849,354,177 |
403,850,713 |
21.8% |
2023 |
26,851,396,438 |
17,147,945,419 |
9,703,457,817 |
2023 |
2,092,443,954 |
947,103,362 |
88.2% |
2023 |
1,590,444,592 |
|
2024 |
1,995,652,112 |
448,997,500 |
22.5% |
2024 |
28,044,633,720 |
17,689,041,837 |
10,355,591,883 |
2024 |
2,129,756,469 |
920,240,652 |
88.3% |
2024 |
1,716,260,816 |
|
2025 |
2,147,863,590 |
470,705,971 |
21.9% |
2025 |
29,528,677,622 |
18,625,096,661 |
10,903,580,962 |
2025 |
2,071,254,644 |
748,091,956 |
87.9% |
2025 |
1,847,162,688 |
|
Grand Total |
9,779,467,382 |
2,156,124,449 |
22.0% |
Grand Total |
104,098,409,947 |
66,384,790,458 |
37,713,572,891 |
Grand Total |
10,296,537,149 |
|
|
|
|
Table 3
|
Row Labels |
Pretax Income |
Tax Provision |
Effective Corporate Tax
Rate |
Row Labels |
Total Assets |
Total Liabilities Net
Minority Interest |
Total Equity Gross
Minority Interest |
Row Labels |
End Cash Position |
End Cash Position after
86% Corporate Tax Rate (End Cash - Hypothetical Tax) |
%Remaining Total Equity
Gross Minority Interest after 86% Corporate Tax Rate (Equity - Hypothetical
Tax) |
Year |
Hypothetical Tax at Rate
0.86 |
|
Financial |
2,843,026,201 |
501,433,823 |
17.6% |
Financial |
134,643,945,159 |
118,311,848,243 |
16,332,096,916 |
Financial |
19,051,380,008 |
|
|
|
|
|
Non ADR |
2,843,026,201 |
501,433,823 |
17.6% |
Non ADR |
134,643,945,159 |
118,311,848,243 |
16,332,096,916 |
Non ADR |
19,051,380,008 |
|
|
|
|
|
2021 |
697,704,171 |
120,941,502 |
17.3% |
2021 |
32,762,989,597 |
28,716,712,440 |
4,046,277,157 |
2021 |
3,326,608,260 |
2,726,582,673 |
85.2% |
2021 |
600,025,587 |
|
2022 |
482,896,739 |
87,870,714 |
18.2% |
2022 |
32,737,876,858 |
28,912,316,968 |
3,825,559,891 |
2022 |
7,043,857,302 |
6,628,566,106 |
89.1% |
2022 |
415,291,196 |
|
2023 |
494,706,450 |
77,812,762 |
15.7% |
2023 |
34,226,645,604 |
30,104,600,241 |
4,122,045,363 |
2023 |
3,030,726,883 |
2,605,279,336 |
89.7% |
2023 |
425,447,547 |
|
2024 |
591,512,390 |
108,852,378 |
18.4% |
2024 |
34,916,433,100 |
30,578,218,594 |
4,338,214,506 |
2024 |
2,874,120,461 |
2,365,419,806 |
88.3% |
2024 |
508,700,655 |
|
2025 |
576,206,451 |
105,956,467 |
18.4% |
2025 |
36,764,113,485 |
32,196,332,751 |
4,567,780,734 |
2025 |
2,776,067,102 |
2,280,529,554 |
89.2% |
2025 |
495,537,548 |
|
Grand Total |
2,843,026,201 |
501,433,823 |
17.6% |
Grand Total |
134,643,945,159 |
118,311,848,243 |
16,332,096,916 |
Grand Total |
19,051,380,008 |
|
|
|
|
Graphs 1-21 scraped from Yahoo Finance. Yahoo Finance Gold subscription would probably improve the quality of this analysis and accuracy of the accounting numbers.
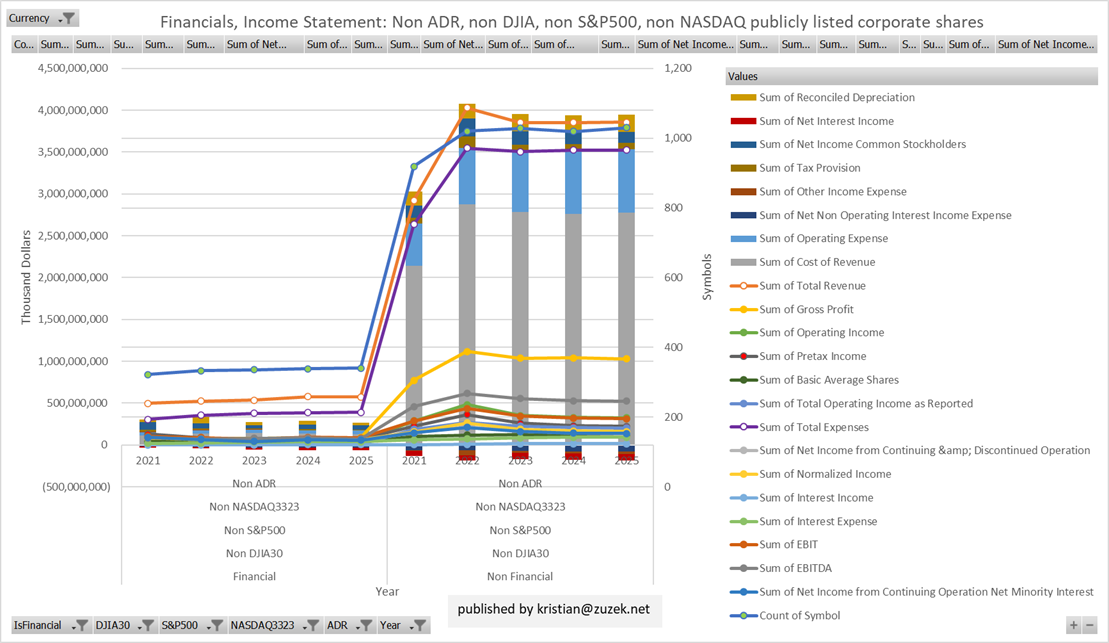
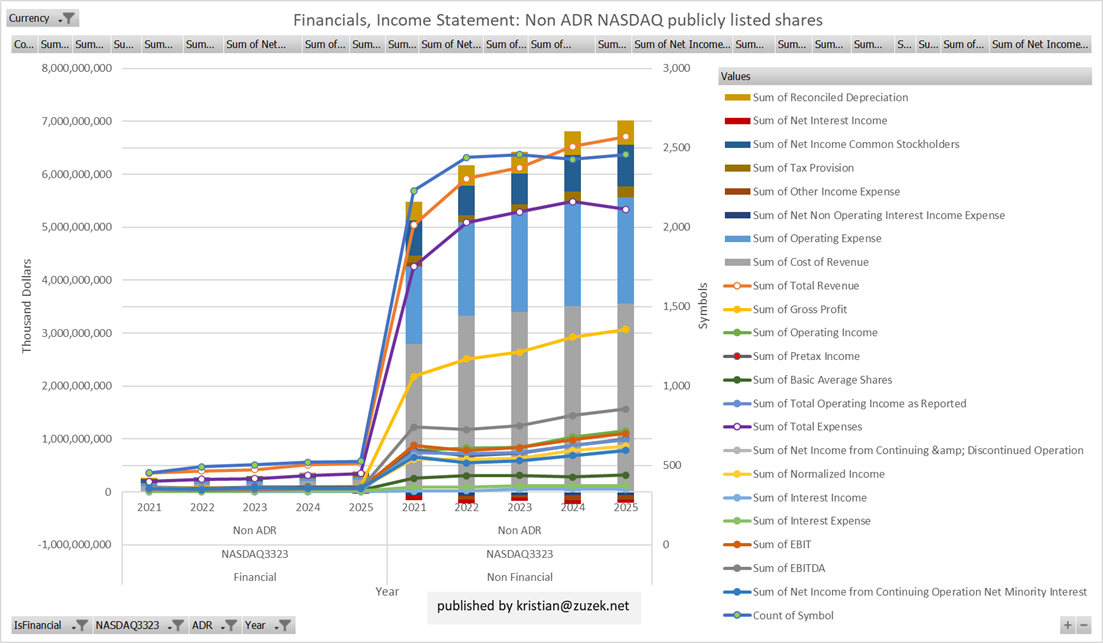
Graph 1-7, Financial Income Statement
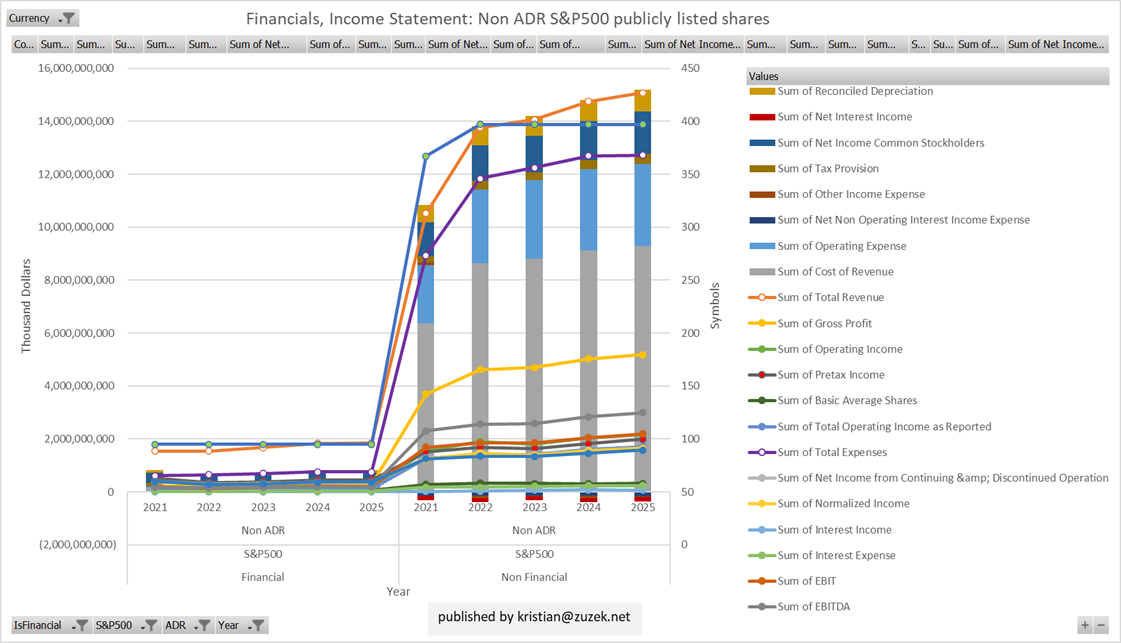
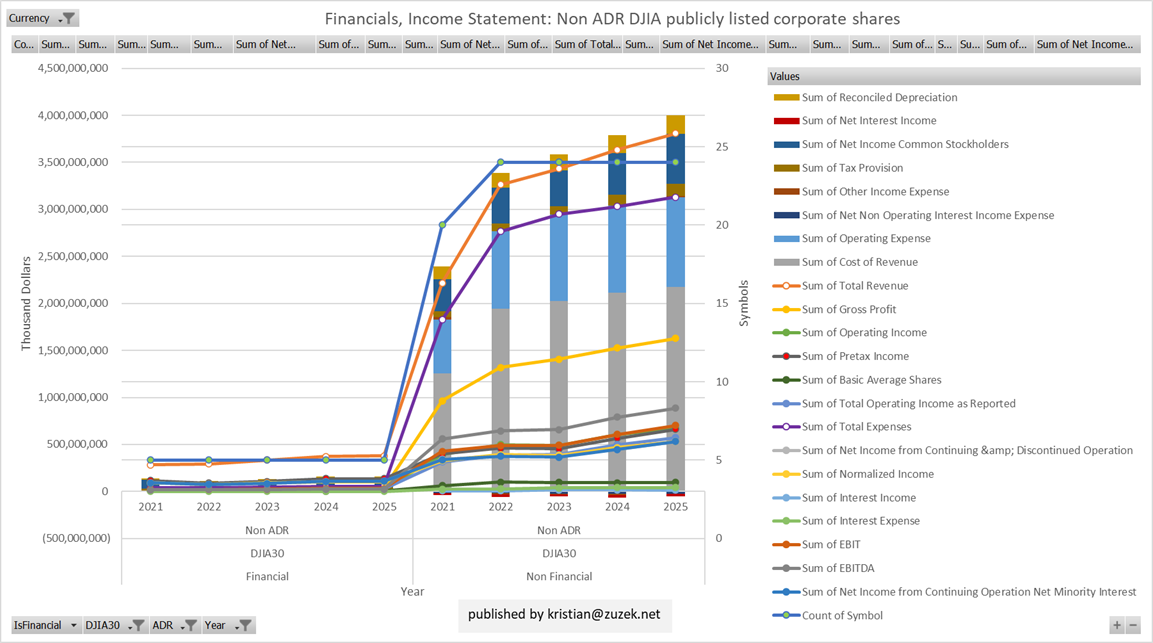
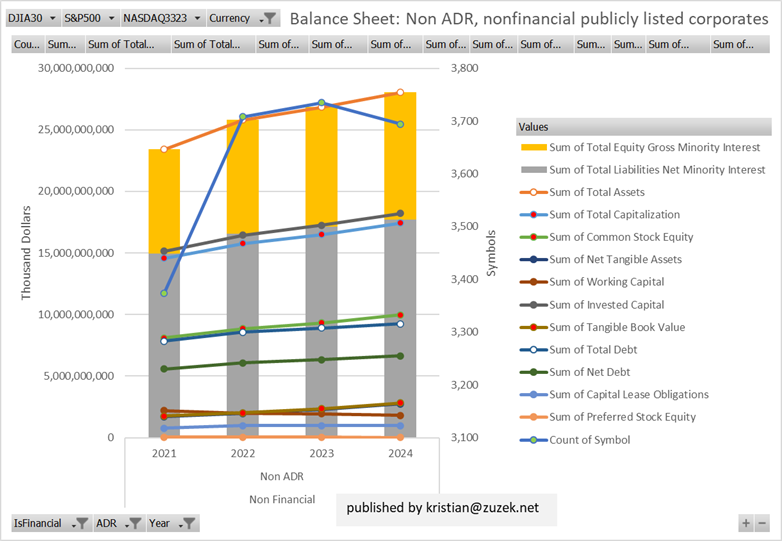
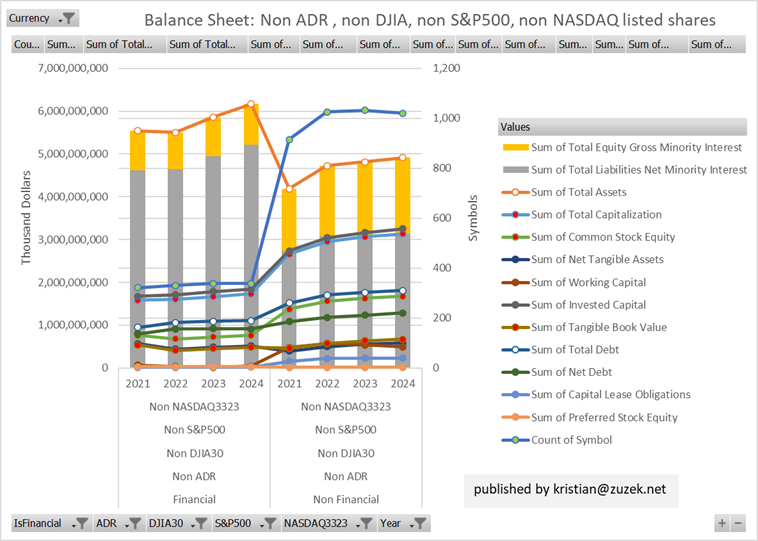
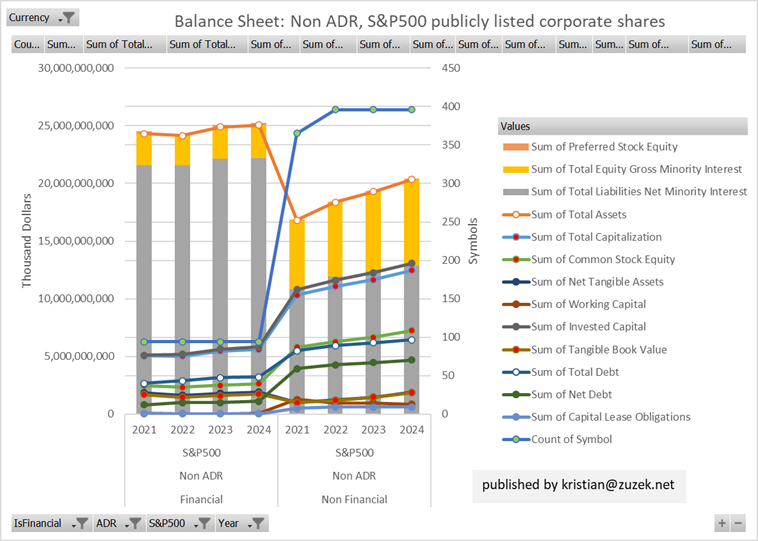
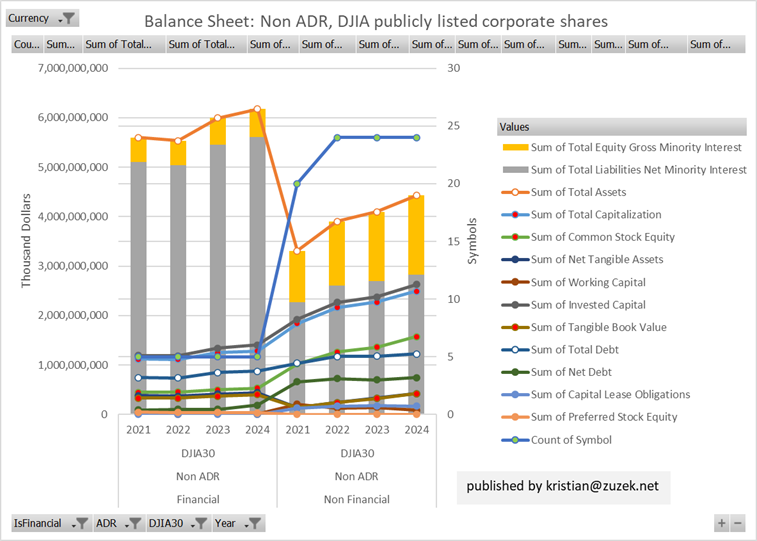
Graphs 8-14, Balance Sheet

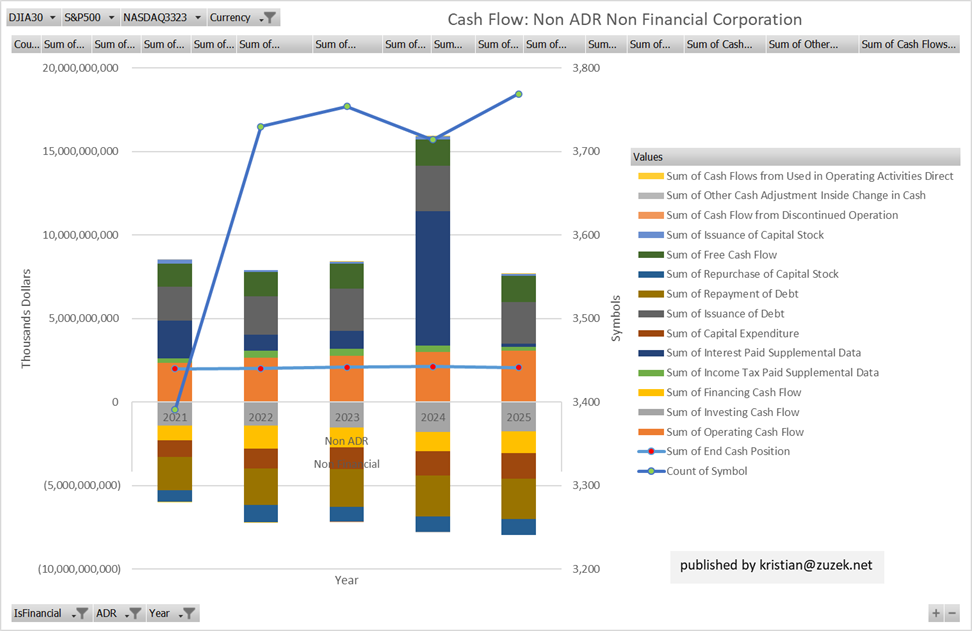
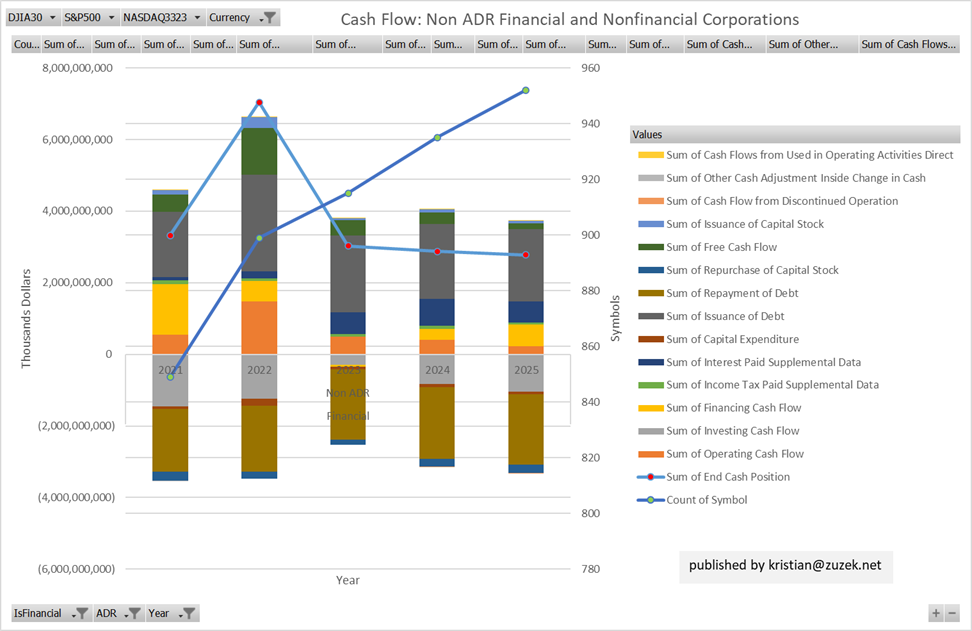
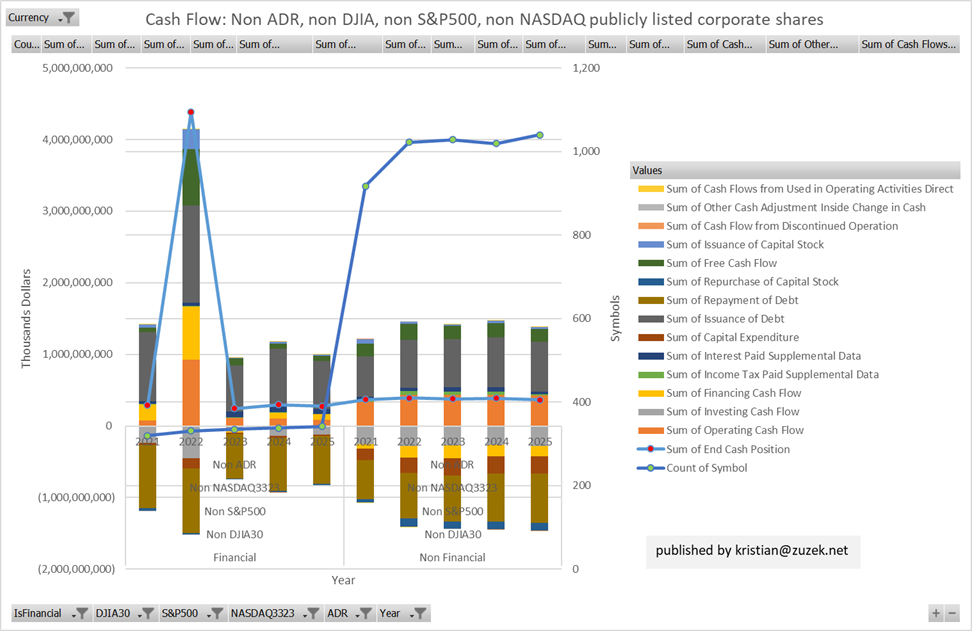
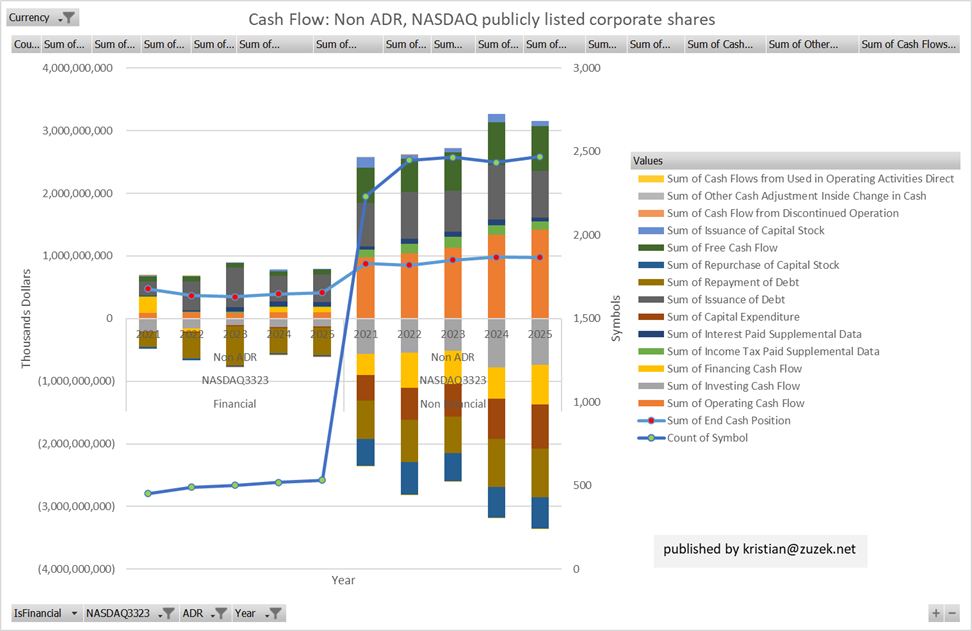
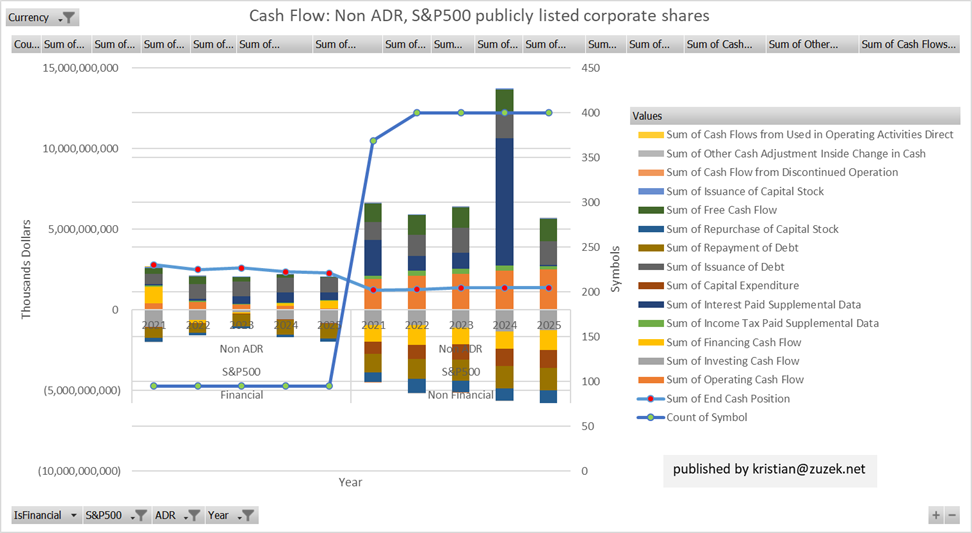
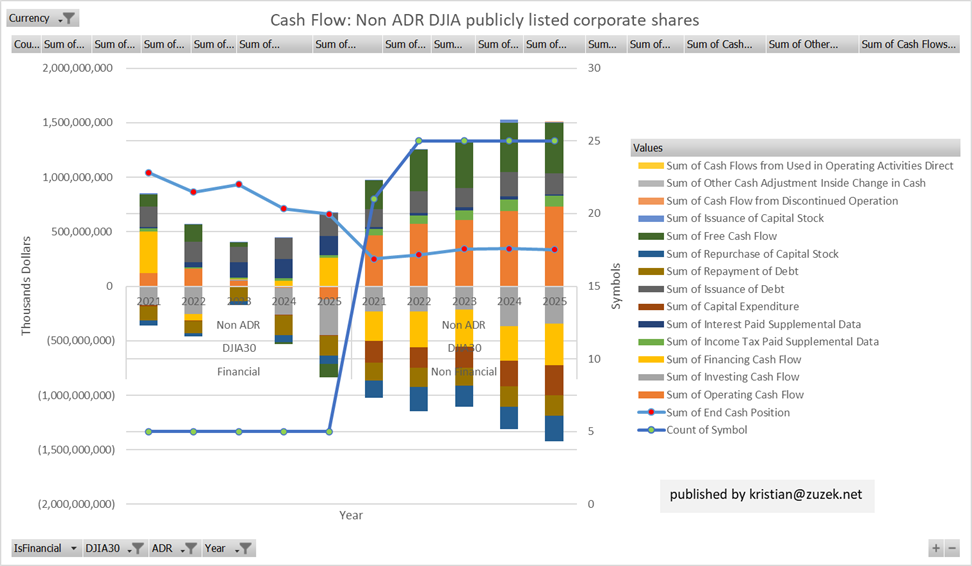
Graphs 15-21, Cash Flow

Perspective on Money and Asset Values
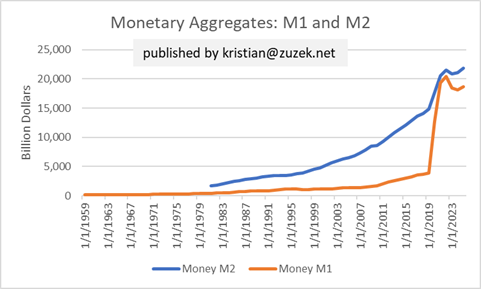
Not my personal opinion, but the numbers of supposedly
reputable institutions publish claim that currently, Currency in circulation is
$2,374.1 billion, M1 is $18,668.0 billion, M2 is $21,830.2 billion. In the recent past, the definition of M1 and
M2 changed, at least in the United States, which is probably more coverup for “human
nature”. It seems as if Severe Acute Respiratory Syndrome, “Corona Virus” has been
one of the most important “financial” factors in history.
Define M2: https://fred.stlouisfed.org/series/WM2NS
Before May 2020, M2 consists of M1 plus (1) savings deposits
(including money market deposit accounts); (2) small-denomination time deposits
(time deposits in amounts of less than $100,000) less individual retirement
account (IRA) and Keogh balances at depository institutions; and (3) balances
in retail money market funds (MMFs) less IRA and Keogh balances at MMFs.
Beginning May 2020, M2 consists of M1 plus (1) small-denomination time deposits
(time deposits in amounts of less than $100,000) less IRA and Keogh balances at
depository institutions; and (2) balances in retail MMFs less IRA and Keogh
balances at MMFs. Seasonally adjusted M2 is constructed by summing savings
deposits (before May 2020), small-denomination time deposits, and retail MMFs,
each seasonally adjusted separately, and adding this result to seasonally
adjusted M1.
For more information on the H.6 release changes and the regulatory amendment
that led to the creation of the other liquid deposits component and its
inclusion in the M1 monetary aggregate, see the H.6 announcements and Technical
Q&As posted on December 17, 2020.
Define M1: https://fred.stlouisfed.org/series/M1SL
Before May 2020, M1 consists of (1) currency outside the
U.S. Treasury, Federal Reserve Banks, and the vaults of depository
institutions; (2) demand deposits at commercial banks (excluding those amounts
held by depository institutions, the U.S. government, and foreign banks and
official institutions) less cash items in the process of collection and Federal
Reserve float; and (3) other checkable deposits (OCDs), consisting of
negotiable order of withdrawal, or NOW, and automatic transfer service, or ATS,
accounts at depository institutions, share draft accounts at credit unions, and
demand deposits at thrift institutions.
Beginning May 2020, M1 consists of (1) currency outside the U.S. Treasury,
Federal Reserve Banks, and the vaults of depository institutions; (2) demand
deposits at commercial banks (excluding those amounts held by depository
institutions, the U.S. government, and foreign banks and official institutions)
less cash items in the process of collection and Federal Reserve float; and (3)
other liquid deposits, consisting of OCDs and savings deposits (including money
market deposit accounts). Seasonally adjusted M1 is constructed by summing
currency, demand deposits, and OCDs (before May 2020) or other liquid deposits
(beginning May 2020), each seasonally adjusted separately.
For more information on the H.6 release changes and the regulatory amendment
that led to the creation of the other liquid deposits component and its
inclusion in the M1 monetary aggregate, see the H.6 announcements and Technical
Q&As posted on December 17, 2020.
Similar to a person with $60,000 per year income having a $500,000 net worth due to borrowing for a mortgage and financial investments so can corporates account large asset bases from lesser yearly income. From the United States federal reserve’s national accounts: (https://www.federalreserve.gov/releases/z1/20250612/html/default.htm)
|
Group |
Value, Billions |
|
B.103 Balance Sheet of
Nonfinancial Corporate Business: Households and nonprofit
organizations; total assets |
63,787.2 |
|
B.101.h Balance Sheet of
Households (1): Nonfinancial corporate
business; total assets |
190,082.8 |
My above analysis includes 5057 of 5483, known to me, publicly listed corporate shares. I think this number does not include “Over The Counter”, non-exchange corporate shares. Of these 5057, the total Balance Sheet values are; Financial Corporates $35 trillion ($21 trillion revenue); and Nonfinancial corporates $28 trillion ($2.5 trillion revenue). I don’t think the missing 426 Nonfinancial corporates have asset values of $35 trillion so either the Federal Reserve’s national accounts are wrong or somewhere in the sum of “Over The Counter” and privately held corporates the missing $35 trillion would be found. Two other sources give varying estimates. Forbes (https://www.forbes.com/lists/top-private-companies/) lists the top 275 private “companies” by revenue in 2024 summing to $2,238.91 billion of revenue, then estimating by ratio 1.66 multiplied by the revenue gives a would be market capitalization of $3,730 billion. Not close enough. From Jacob Robbins (https://www.jacobarobbins.com/), “the four major components of private business wealth: sole proprietorships, partnerships, S corporations, and private C corporations. We estimate aggregate private business wealth of $13.6 trillion in 2017”. And, “In 2017, private companies sold $16.0 trillion of goods and services and netted pre-tax profits of $1.5 trillion, similar in magnitude to the $15.2 trillion in sales and $1.4 trillion in profits of public corporations”. If you adjust $13.6 trillion in 2017 by 36% inflation to estimate 2025 values, then you would estimate $18.5 trillion. If you assume the 426 missing nonfinancial corporates have approximately (426/5057)*35=2.94, then round up to 3, then even from these calculations 35+18+3=56, which is approximately 7 less trillions than the United States Federal Reserve can account the total assets of nonfinancial corporates.
By crude calculation $190 trillion of household total assets divided by 132 million households gives $1.4 million total assets to the average household. Today’s average household earns $60,000 of income plus $15,000 of additional income if I remember my last search through household surveys. The average house is priced near $350,000, meaning the skewed distribution causes the average other assets summing to $1 million to be highly unlikely. I think the average equity investment was closer to $300,000 making $300,000 + $350,000 = $650,000 about $750,000 less than the Federal Reserve’s reported asset value divided by the number of households. I think assets skewed to the higher tax brackets is a known phenomenon.
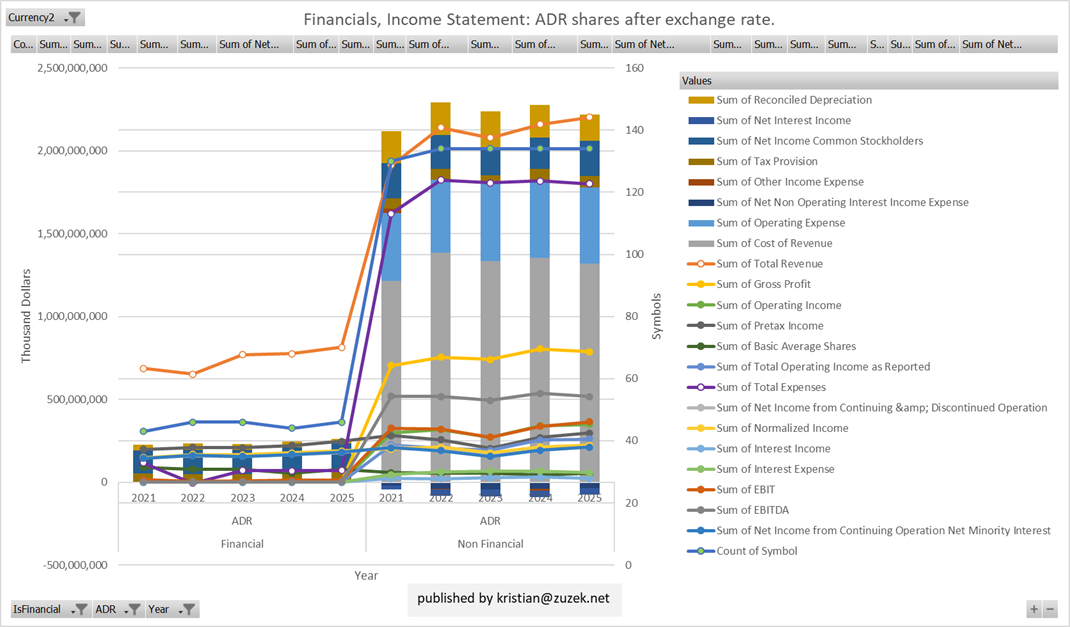
ADR Summary
The ADRs are converted by market exchange rates for each year. Fiscal policy may or may not be coordinated with Monetary policy. In theory, some schools of thought idealize independent Fiscal and Monetary policy but in practice many Monetary policies are highjacked by Fiscal policies needed to coverup human nature.
|
Row Labels |
Total Revenue |
Pretax Income |
Tax Provision |
Corporate Tax Rate |
|
Total Assets |
Total Liabilities Net Minority Interest |
Total Equity Gross Minority Interest |
|
End Cash Position |
|
Financial |
3,698,147,856 |
1,086,036,007 |
252,883,638 |
23.3% |
Financial |
110,863,748,520 |
103,997,205,688 |
6,866,542,831 |
Financial |
13,837,639,247 |
|
ADR |
3,698,147,856 |
1,086,036,007 |
252,883,638 |
23.3% |
|
|
|
|
|
|
|
2021 |
686,960,880 |
197,935,426 |
48,703,769 |
24.6% |
2021 |
19,614,917,331 |
18,349,657,184 |
1,265,260,147 |
2021 |
1,833,151,042 |
|
2022 |
652,629,238 |
210,773,492 |
46,472,573 |
22.0% |
2022 |
28,907,532,997 |
27,200,788,554 |
1,706,744,444 |
2022 |
4,017,307,825 |
|
2023 |
768,903,125 |
207,769,563 |
48,003,951 |
23.1% |
2023 |
30,192,942,809 |
28,329,242,127 |
1,863,700,682 |
2023 |
4,072,918,303 |
|
2024 |
775,008,468 |
222,372,384 |
51,830,836 |
23.3% |
2024 |
32,148,355,382 |
30,117,517,824 |
2,030,837,559 |
2024 |
3,914,262,076 |
|
2025 |
814,646,145 |
247,185,142 |
57,872,509 |
23.4% |
2025 |
|
|
|
2025 |
|
|
Non Financial |
10,494,666,180 |
1,309,443,602 |
309,192,649 |
23.6% |
Non Financial |
18,808,542,010 |
10,965,740,168 |
7,842,801,842 |
Non Financial |
1,568,883,091 |
|
ADR |
10,494,666,180 |
1,309,443,602 |
309,192,649 |
23.6% |
|
|
|
|
|
|
|
2021 |
1,913,568,857 |
280,712,114 |
64,045,730 |
22.8% |
2021 |
4,029,469,801 |
2,348,829,899 |
1,680,639,902 |
2021 |
341,920,551 |
|
2022 |
2,141,420,692 |
257,053,598 |
64,276,967 |
25.0% |
2022 |
4,600,664,063 |
2,694,862,093 |
1,905,801,969 |
2022 |
372,982,767 |
|
2023 |
2,078,237,090 |
204,766,615 |
41,715,081 |
20.4% |
2023 |
4,890,434,575 |
2,839,269,478 |
2,051,165,096 |
2023 |
394,320,078 |
|
2024 |
2,159,779,944 |
270,580,870 |
70,624,930 |
26.1% |
2024 |
5,287,973,572 |
3,082,778,698 |
2,205,194,874 |
2024 |
459,659,695 |
|
2025 |
2,201,659,597 |
296,330,405 |
68,529,941 |
23.1% |
2025 |
|
|
|
2025 |
|
|
Grand Total |
14,192,814,036 |
2,395,479,608 |
562,076,288 |
23.5% |
Grand Total |
129,672,290,530 |
114,962,945,857 |
14,709,344,673 |
Grand Total |
15,406,522,338 |
The Securities Exchange Commission (https://www.sec.gov/investor/alerts/adr-bulletin.pdf) claims, “Today, there are more than 2,000 ADRs available representing shares of companies located in more than 70 countries”. This analysis includes 371 ADRs from 29 countries.
Time Series and Scatter Plot of Federal Deficits Percent of GDP and Corporate Tax Percent of GDP
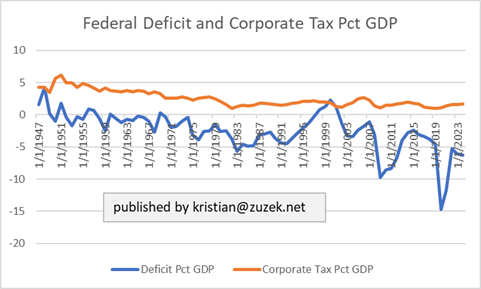
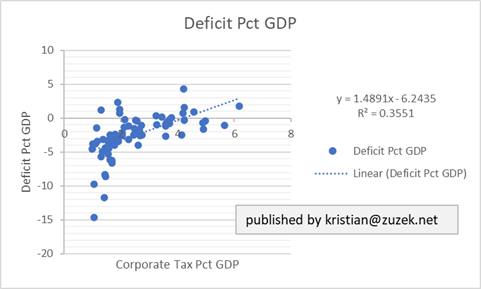
Obviously Corporate Tax and the Federal Deficit are more than statistically related. During times when corporate lobbyists look for expansionary fiscal policy to create “economic growth” then either newly printed money creates inflation if there is no new excess debt issued or inflation is mitigated by the amount of debt issued relative to the amount of new money needed for expansionary fiscal policy. During the digital era, money printing is easier than ever due to the lack of identification that a digital transfer needs to be accounted. In the era of paper money and commodity backed currency there were also “just numbers” written into account books as today and credit transactions that negated the need for a currency bill or currency note. When money is printed, absent of trying to fill in the holes made in fraudulent accounts, interest rates increase proportional to the inflation created. If the interest rates increase then a bank is more likely to buy a treasury bond at an elevated rate before the new money stops creating inflation creating an arbitrage between expansionary fiscal policy’s short term inflation and the time spread of long term inflation reduced by money being stored in a treasury bond. Of course, as a corporate tax will be spent by the government so will the money a bank lends to the government, but sometimes only for accounts payable. If all the new debt used to neutralize expansionary monetary policy is used for accounts payable then the multiplier effect of government spending doesn’t exist and then causes inflation to decrease until new money is printed to pay the interest of the debt used for accounts payable starting the famous inflations which much of the world, possibly temporarily, has become more developed than succumbing to previously. How quickly inflation from expansionary policy decreases back to long term levels is relative to both the laws of the country, and the technology available to create demanded products from domestic resources. If demanded resources and technology are foreign then the laws of your country matter less than the laws of supply and demand, which include the laws of foreign countries. The potential for war by those ignorant to these facts or deluded by their supremacy’s immunity from law is obvious and fills history books.
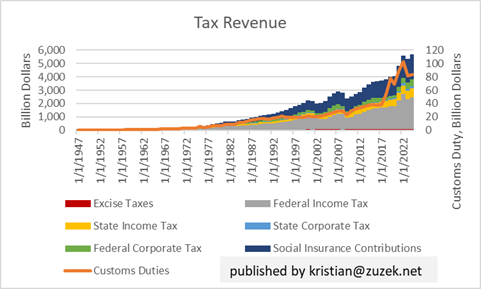
Macroeconomic Series and Accounts
How do customs duties act similar to corporate tax?
If customs duties that are accounted by corporates by increasing costs but not prices would reduce the equity value of publicly listed corporate shares by reducing the amount of assets by the sum of customs duties paid to the government, similar to just tax, subtracted from the cash or retained earnings.
https://www.investopedia.com/terms/r/retainedearnings.asp
What Are Retained Earnings?
Retained earnings are the cumulative net earnings or profits a company keeps after paying dividends to shareholders. Dividends are the last financial obligations paid by a company during a period. “Retained” refers to the fact that those earnings were kept by the company.
If the corporates only increase prices partially to offset the increased import costs then in theory, equity value would decrease by some amount equivalent to the difference of the cost transferred to the endbuyer subtracted from the increased import costs. If the import costs were transferred fully to the endbuyer then the equity value would not decrease. However, any decrease in product quality due to cost increases, or substitution of goods by the endbuyer may change the quantity of items purchased and bought making theory a little bit simplified.
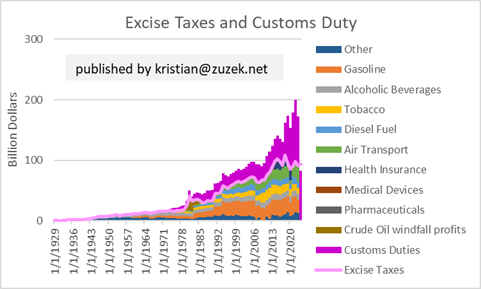
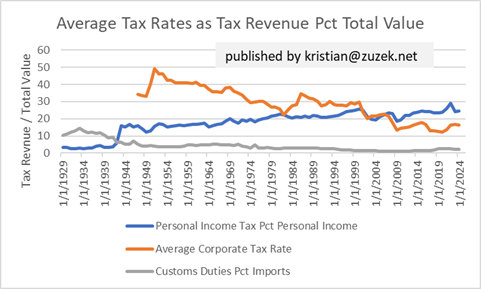
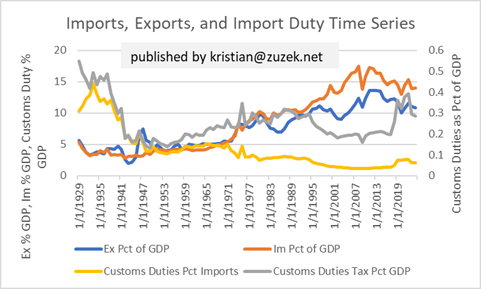
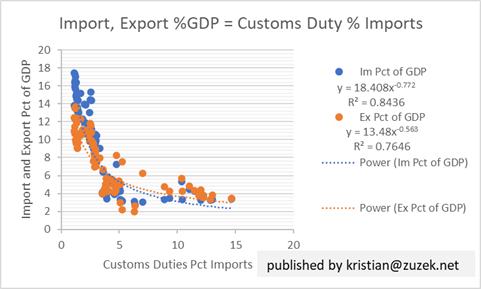
Although the statistical relations of Customs Duties = (Customs Duty Revenue / Total Imports) to the ratio of Imports divided by GDP or Exports divided by GDP are statistically significant, when looking at global data the hypothesis that Customs Duties have a negative coefficient, or relation, to Imports and Exports is not true. As always with economics, politics, and accounting, confusing the resources and development of a country and the specific number statistically estimated as a relation is often not an accounting identity but the summed effects of laws. Not all laws are good, or rich, some laws are bad, or poor.
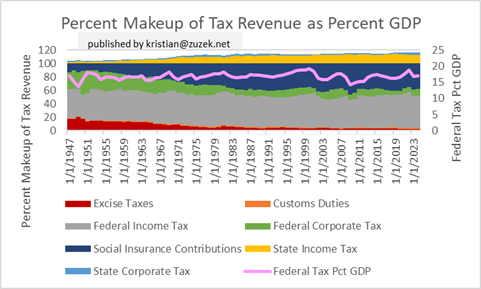
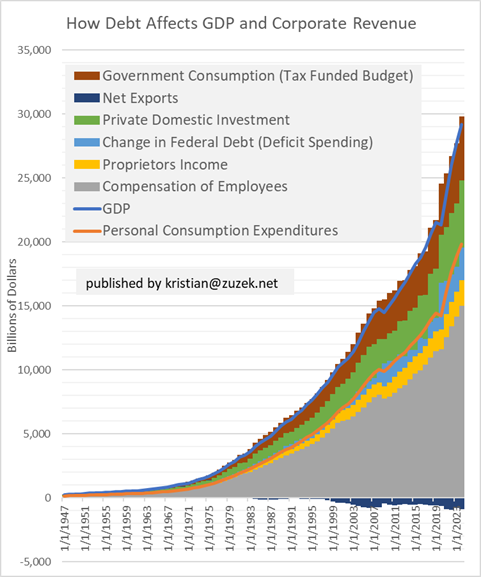
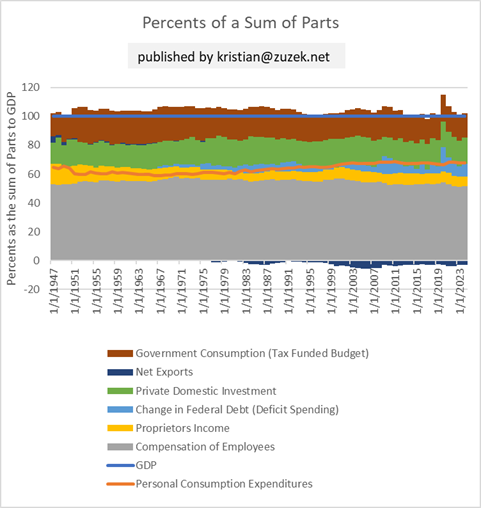
How debt affects GDP and Corporate Revenue
The accounting identity mentioned at the top explains that government revenue would always be spent, unlike corporate revenue which might be retained. The deficit spending decrease seen as the blue section would become Government Consumption (Tax Funded Budget) by the exact amount that more corporate tax is taken.
Conclusion
Whether by corporate tax or customs duties, money can be transferred from corporate accounts to federal accounts. There exists a Customs Duty rate and a Corporate Tax rate that would generate the same revenue. If you try to estimate the import cost increases without looking at the accounts of corporates how could you find this number? If you assume that an 11% to 13% decrease in equity market index values represent the same amount of money transferred from corporate account to federal accounts as shown above in the main example then you would not be far off of the answer. So if equity market indexes decrease by 12% by announcement of new Customs Duties, signifying a $1.8 trillion effect but only a fraction of $1.8 trillion is estimated as government revenues then you should expect that there are compliance costs including building new means of production, regardless of whether or not the new means of production are the most efficient use of human or natural resources. Let us end assuming that a $0.3trillion effect is equivalent to corporate tax rates increasing to 27%.