World Equity and Stock Markets
Demographics, development, and market share.
A gamble on your nation.
The limits of human work. Demographics and Development.
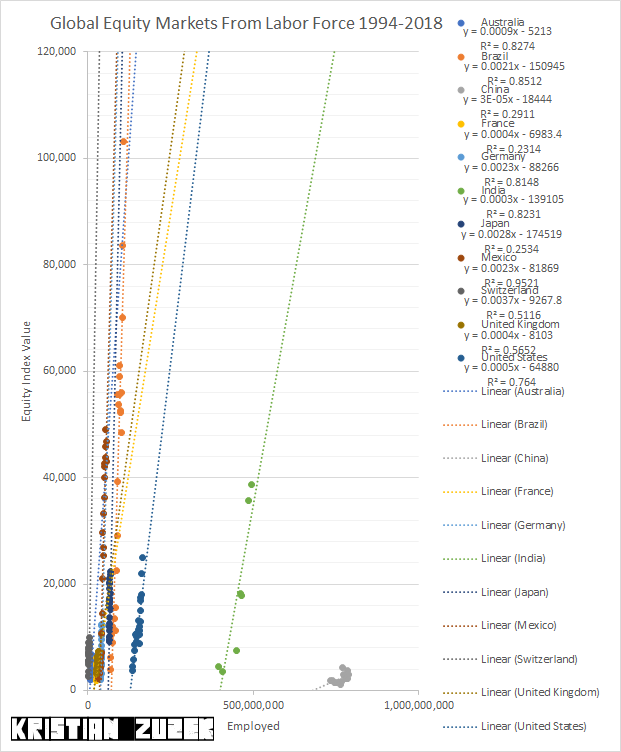
Without having a complete set of retail sales or wholesale stock data, one must draw attention to the obvious: the majority of a stock market tends to be domestic listings. Domestic listings are a representation of the domestic basket of goods that the legal framework of a sovereign has organized into the industrial structure of vertical and horizontal integration. Formally, the global economy is a supply chain hiding behind diplomatic relations which provide protection and a seperate class to the corporations doing business in foreign lands. The average worker provides a different basket of goods to each household in different legal jurisdictions. In some countries a single earner provides food for a family of five; a wife and three kids. In other nations a dual income household earns for a family of three; a single child. Assuming a unit equivalent of "consumable goods" the multiplier for the single provider would be 5 units multiplied by the cost of the basket of goods while the multiplier for the dual income household would be 3/2 multiplied by the cost of an equivalent basket. In the local currency of each sovereign, the number representing the equivalent basket would be different which describes the different absolute levels of each equity index. Additionally, each equity index may contain a different number of public listed companies however the standard equity index for each nation is designed to represent the top of each industrial vertical representing the aggregate of an economy and the culture of a people.
Production Output Power
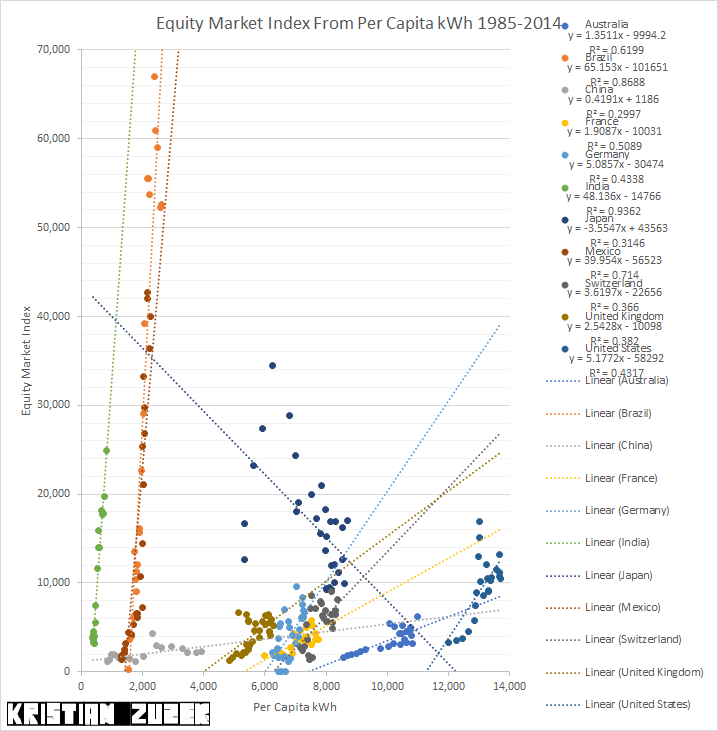
Historically the level of output a nation would produce was related positively to the amount of energy consumed by their economy. The electricity in the factories and the fuels to transport. The ability to produce the goods for 10,000 people in one factory instead of only for 1,000 people as during a previous decade was observed as real growth and efficiency at the specific location. It is possible to estimate one quarter of the world being fully developed relative to current technology. The number of goods possessed by the developed portion of global population doesn't change but they are preiodically replaced. With low population growth and an almost certain number of goods from a basket of globally supplied goods capable of being produced with less energy and contained polution then the positive relation between energy and economic output can become a negative relation.
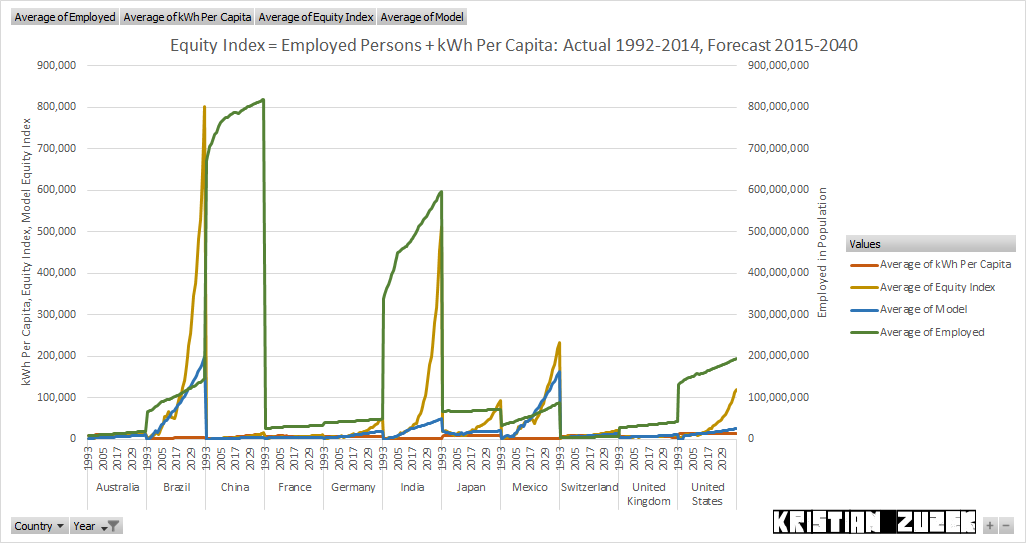
Comparing a model of equity index prices for each stock market to a growth trend gives the following table of results.
| 1990 | 2000 | 2010 | 2020 | 2030 | 2040 | |
| ASX | 1764 | 4121 | 5305 | 7853 | 11682 | 14378 |
| Employed + kWh Per Capita | 2065 | 4016 | 5265 | 6900 | 8913 | 10170 |
| Australia Model Error Pct | 0.171 | -0.025 | -0.008 | -0.121 | -0.237 | -0.293 |
| BVSP | 4550 | 31236 | 65337 | 177266 | 483686 | 801305 |
| Employed + kWh Per Capita | 3964 | 31504 | 68064 | 110041 | 163242 | 198194 |
| Brazil Model Error Pct | -0.129 | 0.009 | 0.042 | -0.379 | -0.663 | -0.753 |
| SSE | 380 | 2114 | 2785 | 4787 | 10556 | 15033 |
| Employed + kWh Per Capita | 375 | 2062 | 2596 | 2866 | 3187 | 3362 |
| China Model Error Pct | -0.013 | -0.025 | -0.068 | -0.401 | -0.698 | -0.776 |
| CAC | 2466 | 4471 | 4431 | 6273 | 8451 | 10153 |
| Employed + kWh Per Capita | 2621 | 4231 | 3604 | 3311 | 3339 | 3343 |
| France Model Error Pct | 0.063 | -0.054 | -0.187 | -0.472 | -0.605 | -0.671 |
| DAX | 2776 | 5336 | 9585 | 17594 | 35348 | 50403 |
| Employed + kWh Per Capita | 2941 | 5377 | 8269 | 12704 | 16919 | 19408 |
| Germany Model Error Pct | 0.059 | 0.008 | -0.137 | -0.278 | -0.521 | -0.615 |
| Sensex | 1131 | 8374 | 25787 | 81335 | 282996 | 511486 |
| Employed + kWh Per Capita | 939 | 8407 | 22992 | 32418 | 42734 | 49441 |
| India Model Error Pct | -0.17 | 0.004 | -0.108 | -0.601 | -0.849 | -0.903 |
| Nikkei | 19918 | 12685 | 15848 | 33182 | 63248 | 92761 |
| Employed + kWh Per Capita | 18548 | 12811 | 15541 | 18079 | 19057 | 19639 |
| Japan Model Error Pct | -0.069 | 0.01 | -0.019 | -0.455 | -0.699 | -0.788 |
| IPC | 2686 | 15443 | 42283 | 68944 | 164120 | 233189 |
| Employed + kWh Per Capita | 2079 | 16486 | 44365 | 83607 | 131491 | 162314 |
| Mexico Model Error Pct | -0.226 | 0.068 | 0.049 | 0.213 | -0.199 | -0.304 |
| SSMI | 3605 | 6695 | 7999 | 12049 | 17497 | 21589 |
| Employed + kWh Per Capita | 3693 | 6449 | 7637 | 9410 | 11891 | 13300 |
| Switzerland Model Error Pct | 0.024 | -0.037 | -0.045 | -0.219 | -0.32 | -0.384 |
| FTSE | 3727 | 5248 | 6519 | 6871 | 8248 | 8974 |
| Employed + kWh Per Capita | 3627 | 5529 | 5831 | 7448 | 9451 | 10622 |
| United Kingdom Model Error Pct | -0.027 | 0.054 | -0.106 | 0.084 | 0.146 | 0.184 |
| DJIA | 4747 | 10466 | 17664 | 39059 | 80204 | 120411 |
| Employed + kWh Per Capita | 2319 | 10921 | 13865 | 18146 | 22416 | 24971 |
| United States Model Error Pct | -0.511 | 0.043 | -0.215 | -0.535 | -0.721 | -0.793 |
Conclusion
As one would expect, the in sample decades of the 2000s and 2010s have relatively good model fits and aggregate errors.Periods in the 1990s, which are not part of model generation, perform less well especially in what were considered "emerging markets".
Periods forward from the 2020s to the 2040s also do not fit well compared to a growth trend which does not include changes such as a possible negative relation between economic output and energy consumption. It is possible that statistically observing efficiency programs in various countries creates a discovery bias towards a negative sign instead of a positive sign in front of the coefficient for kWhPerCapita.